
One of the challenges of planning a Disney World trip in the near future is that crowds and wait times are hard to predict. None of the old trends apply anymore. Inside the parks, capacity controls, ride loading procedures, sanitation procedures, and the loss of FastPass+ all impact wait times.
Outside the parks, the ongoing pandemic impacts people’s willingness to travel. Besides directly impacting crowd levels, this also impacts crowd composition. Parks with 25% locals and 75% tourists (made up numbers) see different trends than parks with 75% locals and 25% tourists.
As a fun—yes, fun—new project, we’re producing wait time “scorecards” that look back at the last week of wait times at each park to identify trends. I emphasize fun because I’m not doing any of the serious statistical analysis you might see at a place like Touring Plans.
The upside, though, is that this information should be clear enough for most readers to understand and evaluate themselves.
The rest of this post is about the scorecards. It explains why I use the metrics I use and what works and what doesn’t about those metrics. The most recent scorecards are here:
I’m hoping to update thesee weekly. If you’d like, you might sign up for our email list to receive updates by email:
Data Source
I typically use wait time data collected by Thrill-Data.com, and I usually specify the source in each post. This is data collected from the publicly posted Disney World wait times (you can find them in the My Disney Experience app).
In Epcot, Animal Kingdom, and Hollywood Studios it’s easy to look at all or nearly all of the rides. At Magic Kingdom, it makes sense to focus on about half of them, because (as of this writing) the less popular rides just sit a 5 minutes almost all week.
In all our analysis, it’s important to remember that posted wait times aren’t always accurate. While they’re generally a good indicator of how busy the park is, they’re imperfect. Let’s talk more about that…
Bad & Good of Wait Time Analysis
While it’s nice to have access to wait time data, you can’t use that information alone to plan a day at the parks. There are two big reasons why:
First, the posted wait times are often inaccurate. I saw one person this week say they waited 35 minutes for Mickey & Minnie’s Runaway Railway (at Hollywood Studios) when the posted wait was 90 minutes.
I’ve made numerous visits to Magic Kingdom where I ended my morning getting on Jungle Cruise right as wait times posted 20 minutes but the ride was still a walk-on. That was a “trick” I learned from being in the parks, not from looking at data.
Second, touring strategy is usually not just about wait times. You don’t want to run back and forth across the park, you don’t want to ride some rides right after lunch, and you’ve usually got a bunch of other things (like shows) that you’re trying to fit into your day. That said, most people (including us) writing a lot about wait times probably know enough to avoid giving you bad advice.
Finally, wait time analysis is always looking backwards. While you might know a shift in crowds is around the corner, that won’t show up when I look at last week’s numbers. In the immediate future, this is probably not a big issue as I don’t expect crowds to suddenly shift, but it’s a good thing to remember.
But wait time analysis also has some advantage. Anyone can go to the parks and post the order they went to rides, and the times they waited, but that data is useless unless you know if that day is typical.
There is a lot of wait time data, and it’s easy to get. With wait times available every five minutes, you can put together a pretty good picture of what wait trends at the parks look like. You’d need hundreds of people constantly waiting in line to get anywhere near that amount of actual wait time data.
You also usually make decisions based on posted wait times, not actual wait times. When you’re in the park, you look at posted wait times. I mentioned that Jungle Cruise example above because it was a rare case where I recommended people always go to Jungle Cruise right at that time regardless of what the posted wait time was.
For the most part, you’re going to get off a ride, check the wait times, and pick from that. Since that’s the data driving your decisions, it’s helpful to know what that data is going to say even if it’s imperfect.
About Our Analysis
This is small data / simple analysis. This isn’t a statistics project. While I find all this information interesting, you also could do a post’s worth of analysis on any single data point we report to explain why it is or isn’t significant.
I tried to choose data points that were simple to understand, relevant to planning, and occasionally somewhat beyond what you’d personally do with the data. In the rest of this post, I’ll explain why I chose the data points we use and what’s good and bad about these data points.
For what’s it’s worth, I have an undergraduate degree with a major in mathematics, and I’m current a master’s student in mathematics. I don’t think that’s worth much because this isn’t complicated data (and in any case I’m not particularly a statistics expert), but at least you can count on me to be somewhat comfortable with data.
Average Wait Time
Average Wait Time is the average (mean) of all the posted wait times for the ride for the week. If the ride experienced downtime, that time is excluded from the average. Average Wait Time is a nice place to start because we all understand it, and it’s a lot of information distilled into a single point.
From a planning perspective, Average Wait Time is very incomplete. Here are three (fake) wait time charts for rides with an average wait time of 15 minutes:

Ride 1 stays at 15 minutes all day. Ride 2 starts and ends the day at 0 minutes, but spends the middle of the day at 30 minutes. Ride 3 starts at 0 and gradually increases to 30 minutes at the end of the day.
If you’re planning, you want to know to visit Ride 3 first, then Ride 2 in the morning, then Ride 1 anytime for a total wait of 15 minutes. If you visit Ride 1 first, then Ride 2 midday, then Ride 3 at the end of the day, you wait 75 minutes.
The examples I’ve given are silly, but rides do have different patterns. Water rides, for example, have a strong tendency to peak when temperatures are warmest. On a February day, you’re unlikely to see anyone on Splash Mountain until about 11AM. This brings us to the next “metric” we use, Daily Trends.
Daily Trends
This isn’t a single metric, but next to the average wait we include a miniature chart that shows how the average wait time varied for the ride throughout the day.
The biggest problem with this is that—because of my poor Excel skills with Sparklines—I can’t get the Y-axis to post. This means a ride that varies between 5 minutes and 10 minutes all day long can look like a series of wild peaks and valleys even though it’s actually quite boring.
Other than that, this is a good way to check if a ride should be visited early, midday, or late. The go-to example (as of this writing) is what’s happened at Animal Kingdom:
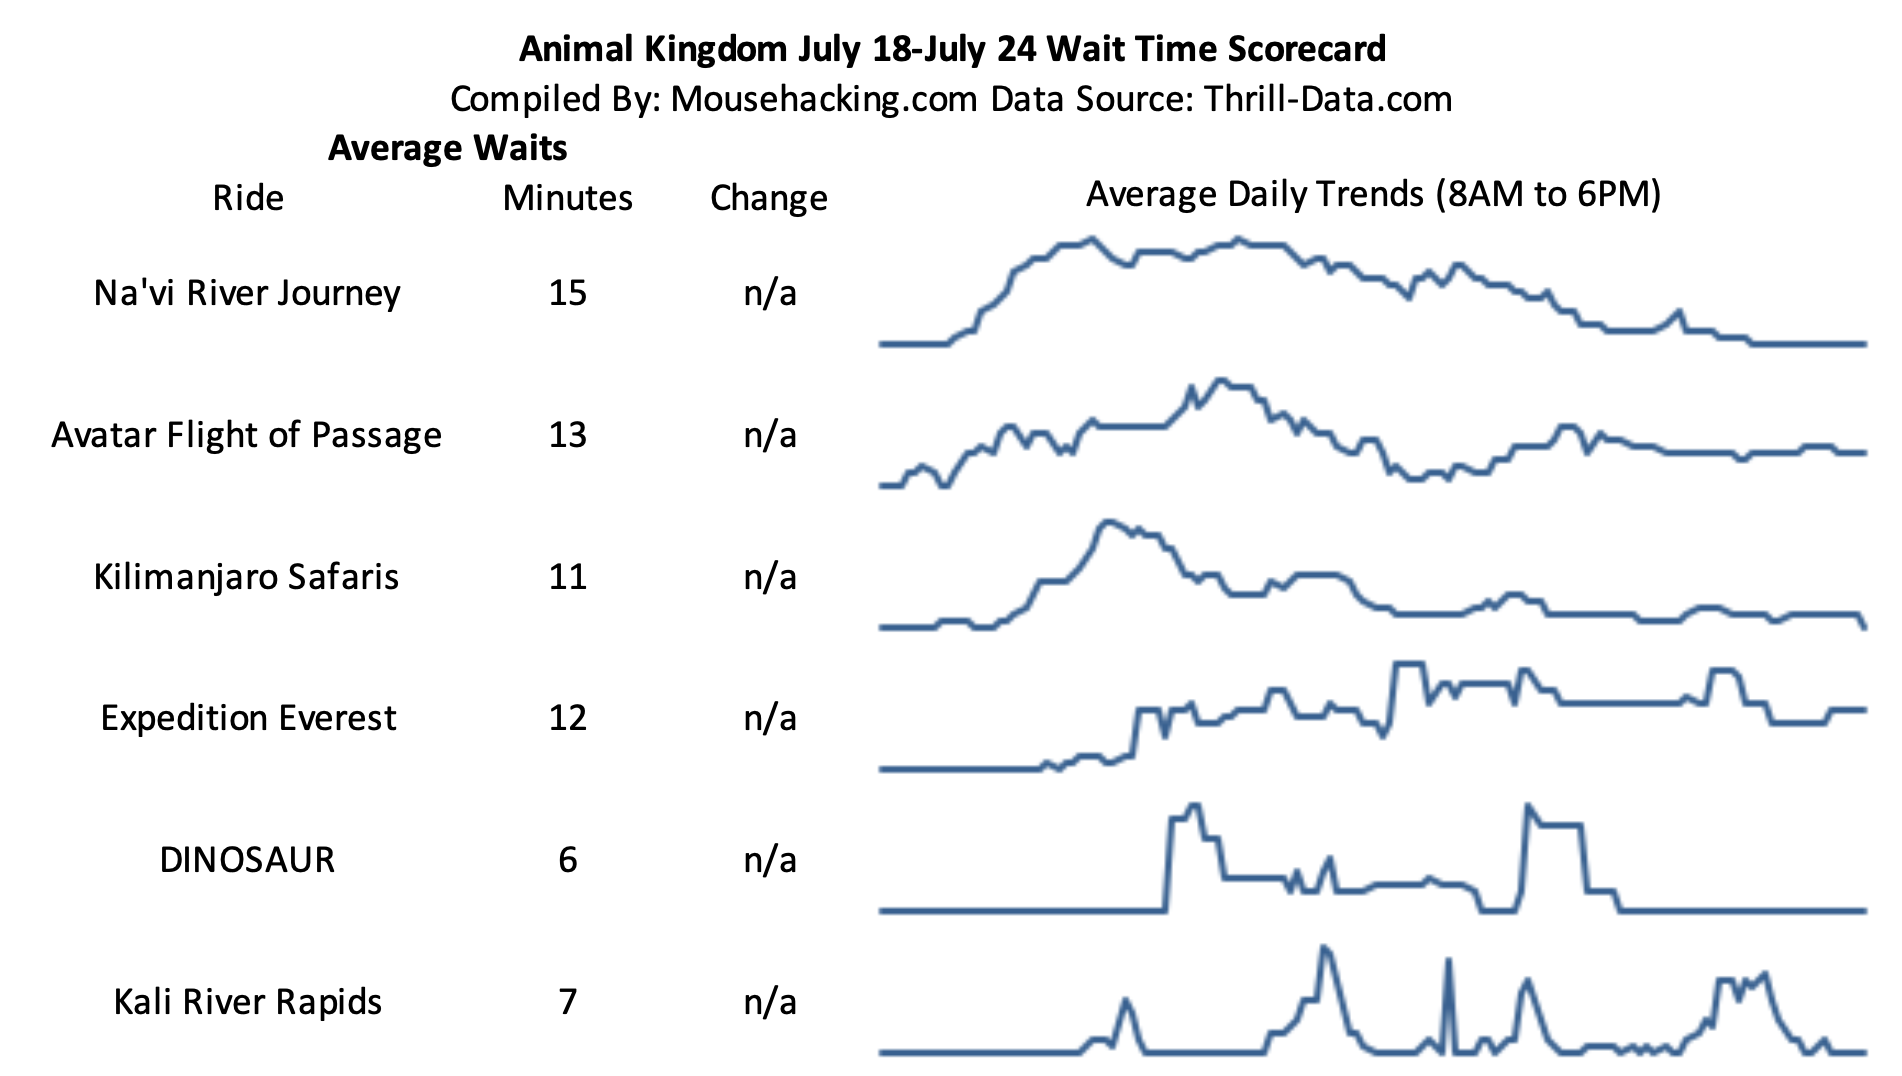
You can see Na’vi River Journey has a longer average wait than Flight of Passage, but it starts the day pretty low. This means you can arrive and walk right onto Na’vi River Journey, knocking out the “busiest” ride in the park. Alternatively, if you arrived early enough you could walk right onto Flight of Passage and then right onto Na’vi River Journey, since its wait usually won’t go up while you ride Flight of Passage.
Maximum Wait Time
Maximum wait time is the highest wait time that was posted for a ride in a given period of time (usually a single day). While it has an intuitive appeal if you want to see how high crowds are, it’s also very problematic because it’s easy for Disney to misjudge, for example, a 60-minute wait and post it at 75 minutes.
That’s not a huge difference for guests, but 25% is huge when you’re looking at trends in wait times. What’s more, the ultra-high waits (anything over 90 minutes, I’d say) are usually off but a pretty significant margin. I’ve had 120 minutes turn out to actually take 85 minutes, and just last week I saw someone report a 90-minute wait that was actually 35 minutes.
Median Afternoon Wait Time
This metric replaces the previously used “Lowest Afternoon Wait Time,” discussed below. Media Afternoon Wait Time for a ride on a day is the median (middle) wait time seen in the afternoon (typically 12PM to 5PM) for that ride.
This means if you looked at all the posted wait times for that time period, half would be at or above this time, and half would be at or below this time.
I like to look at this 12PM to 5PM time frame because it’s usually the worst time to have to be in line. It’s hot. Lines are long because you’ve got late arrivals showing up but most people haven’t left the park yet. So it’s good to know that if your morning plans don’t quite work out and you have to push a ride into the afternoon, what kind of wait can you expect?
Lowest Afternoon Wait Time
Note: This metric won’t be used going forward. I use this metric, usually with a 12PM to 5PM timeframe, but not always, because the afternoon is historically peak crowds for a theme park. So this metric asks “if I’m stuck in the park during peak times, what’s the best I can hope for?”
As with Maximum Wait Time, a single data point is always somewhat sloppy. A ride might break down, reopen with a 5 minute wait, and jump to 60 minutes. In that case, the “lowest” would be 5 minutes even though you would have needed to be standing outside the ride to get that wait.
Also, afternoon isn’t always going to be peak wait times. At Hollywood Studios, morning crowds rushing in to try and get a Rise of the Resistance boarding group often make morning waits higher than afternoon waits.
% of [Time Periods] At or Under…
Note: I used to do % of entire week at or under a given time. I now more commonly use on the 12PM to 5PM range.
This is my favorite metric we use, but it’s also the most complicated (which is still not very complicated). With this metric, we’re asking what percentage of the week the ride had wait times at or below a given time.
Unlike the data points that use day-by-day tables, this data looks at the entire week at once. This allows you to get a bird’s-eye view of the last week:
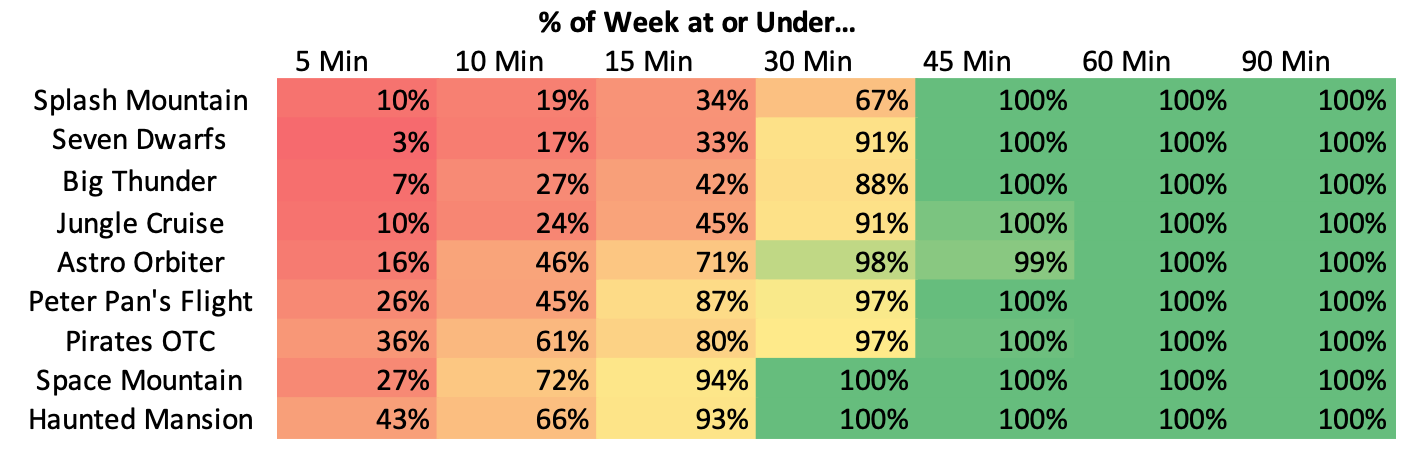
So in the above table, you can see Big Thunder Mountain Railroad spent 88% of the week with waits either at or below 30 minutes, but only 42% with waits at or below 15 minutes.
Seven Dwarfs Mine Train spent 91% of the week with waits at or below 30 minutes, but was almost never at or under 5 minutes (3%). That week, it was nearly impossible to come across a ride with a wait time above 45 minutes.
Downtime
Downtime is based on gaps in the data at Thrill-Data.com. I’ve checked this against other sources and it mostly seems to correspond to the ride being temporarily closed, but it won’t always be that.
For example, over at Epcot, Gran Fiesta Tour doesn’t always post a wait time. Sometimes it just isn’t included in the active wait times because it is so often at 0 minutes, not because it’s down. As a result, if it were up for some of the day and then taken off the wait times midday, it might look like 50% downtime even though it ran all day.
Also, downtime is often weather-related. In some ways that matters for how you read the data, and in some ways it doesn’t. On the one hand, if you want to visit a ride it doesn’t really matter to you why it’s closed if it’s closed.
On the other hand, you can plan around bad weather. You can’t plan around random breakdowns. Some rides might be down 25% of the day because of thunderstorms, but if you simply avoided being in the park at that time, you’d have no problems.
I don’t love downtime as a metric, but it’s somewhat helpful because you might want to know how much to “hedge” when comparing two rides. In the first week it reopened, Test Track was closed around 1/3 of the time. This meant that even if the wait was a little above average, it was probably worth hopping in line while it was still working.