
In this post, we look back at wait times for the first month (or so) the Disney World parks have been reopened. We look at each park, resort-wide trends, and compare things to what crowds were like in 2019. Read on to see how wait times have changed at Walt Disney World this summer!
About This Post
I don’t look at every ride because some aren’t as impacted by changing crowds when crowds are overall this low. For example, TriceraTop Spin has sat at 5 minutes almost constantly since Animal Kingdom reopened. We also only look at the ten busiest rides at Magic Kingdom.
Throughout the post, when I mention individual rides, I also note the average wait over the last seven days. All the charts are also based on rolling seven-day averages. The data is from Thrill-Data.com.
I’ve written in the guide to our wait time scorecards that wait times are imperfect data, but they’re the best we have for trying to analyze crowds at the parks. We also have an ongoing series of wait time scorecards where we discuss how strategies are developing as crowds change at the parks:
General Trends
All four parks have seen roughly the same pattern in waits. They increased slightly from opening through July, peaking around August 1. Waits then dipped for a few days, the dates that Hurricane Isaias was predicted to impact the area. They then increased again into mid-August (probably with “last summer visit” crowds) before dropping off as kids went back to school.

data source: Thrill-Data.com
If you ignore the likely impact of the Hurricane forecast, waits basically increased from an average of 16 minutes in mid-July to 21 minutes in mid-August, before dropping back to 19 as kids went back to school.
Hollywood Studios has seen the longest waits. This makes sense, as the park has a relatively small number of rides and keeps guests around as they wait for their slot in the Rise of the Resistance virtual queue. Magic Kingdom waits have also been high, but I’d remind you we only are looking at the top ten rides at that park. Animal Kingdom and Epcot have seen the lowest waits.
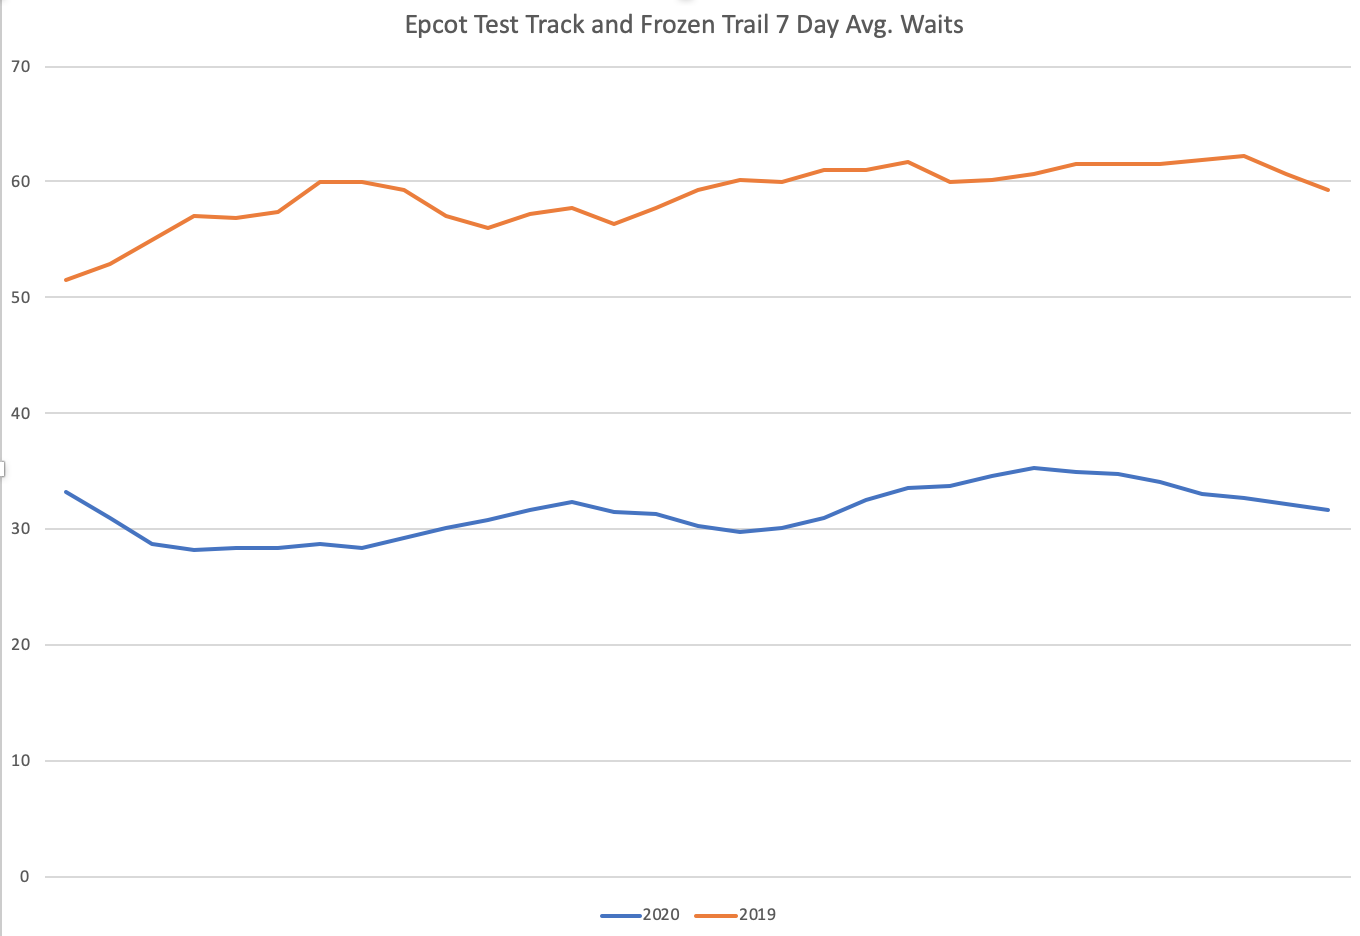
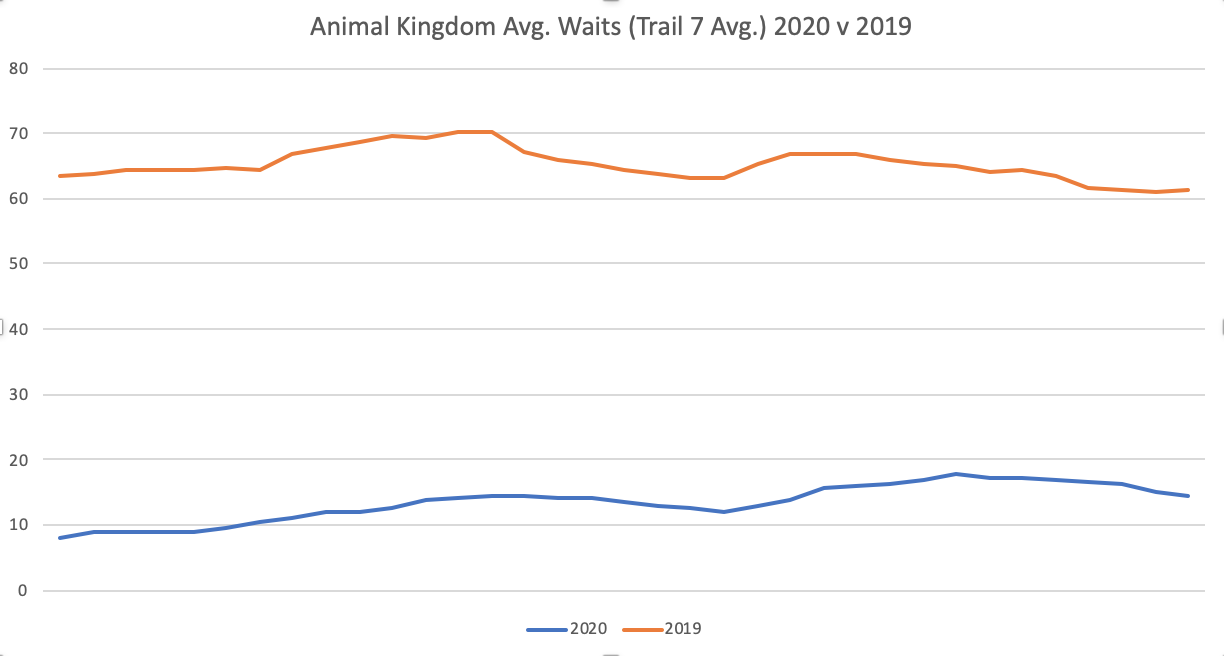
2020 vs. 2019
Unsurprisingly, waits are much lower in 2020 than they were for the same (day-of-week adjusted) period in 2019. Hollywood Studios numbers aren’t worth a look because the park has changed so much, but the other three parks offer some insights. Use the arrows to tap through the three slides (data source: Thrill-Data.com):
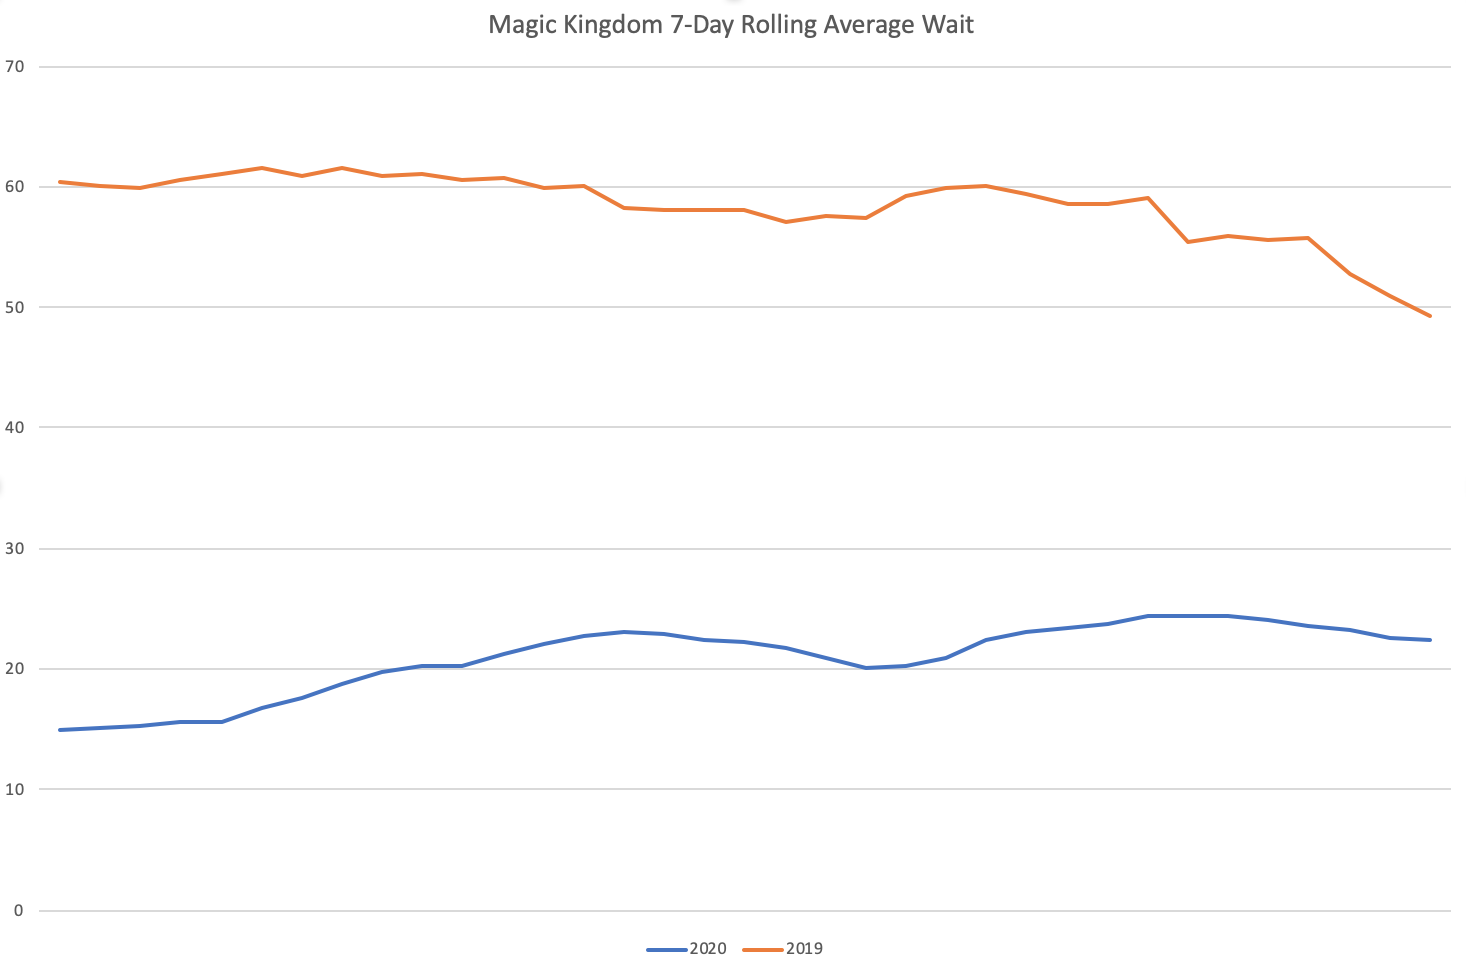
At Magic Kingdom, looking at the ten most popular rides in 2020 vs. those same rides in 2019, we see average waits of 15-25 minutes in 2020 versus 55-65 min in 2020.
At Epcot, we can compare the average waits for Test Track and Frozen Ever After, and we see waits of 30-35 minutes in 2019 vs. 50-60 minutes in 2020.
Animal Kingdom is the most extreme. If we look at average waits on all the rides except TriceraTop Spin (and the now-closed Primeval Whirl), we see waits of under 20 minutes in 2020 but consistently over an hour in 2019.
Notably, I’ve had people tell me that without FastPass+ they’re having an overall more challenging time in 2020, particularly on the most popular rides. If you really hate lines—like we do—you might find a small selection of 20-minute waits more annoying than the old 90-minute waits you skipped with FastPass+.
Park-By-Park Analysis
Now, let’s take a quick look at each park individually.
Animal Kingdom
At Animal Kingdom, Na’vi River Journey (20 min) and Avatar Flight of Passage (18 min) have generally had the longest waits in the park. Expedition Everest (16 min) currently has a strong hold on the #3 slot, as Kilimanjaro Safaris (12 min) has interestingly dropped off a bit the past few weeks, and now has waits more comparable to DINOSAUR (11 min) and Kali River Rapids (10 min).

data source: Thrill-Data.com
Hollywood Studios
Mickey & Minnie’s Runaway Railway (46 min) has consistently had the highest waits since the park reopened, though we’ve seen plenty of reports that these waits are way overstated (could also be true of many other rides, though). Slinky Dog Dash (35 min) has usually held the second spot in the park, though for a while Tower of Terror (27 min) was in that spot. It’s possible that Tower was operating at reduced capacity for a while.
Now, it’s Millennium Falcon: Smugglers Run (31 min), Rock ‘n’ Roller Coaster (26 min), and Tower (27 min) have pretty similar waits. And Toy Story Mania (14 min), Star Tours (14 min), and Alien Swirling Saucers (11 min) have had consistently low waits.

data source: Thrill-Data.com
Epcot
Epcot has been exactly what you’d expect. Frozen Ever After (31 min) and Test Track (32 min) are by far the busiest rides in the park, with Test Track usually having the higher wait. Soarin’ (16 min) and Mission: SPACE (15 min) are the next busiest, while Living With the Land (10 min), Spaceship Earth (7 min), The Seas with Nemo and Friends (6 min), and Journey Into Imagination (5 min) are easy to fit anywhere in the day.

data source: Thrill-Data.com
Magic Kingdom
Magic Kingdom has had a few surprises. As of this post, Splash Mountain (33 min) and Seven Dwarfs Mine Train (33 min) are virtually tied for longest average wait in the park. Splash Mountain is probably seeing high crowds because (1) it’s hot and (2) the ride is slated to be re-themed to Princess and the Frog at some point. At the end of July, Splash had a huge lead over Seven Dwarfs Mine Train (45 min vs 34 min).
Big Thunder Mountain Railroad (29 min) is consistently the third busiest ride in the park, and Jungle Cruise (25 min) and Pirates of the Caribbean (24 min) round out the top five.
While there have been a few changes in the 6-10 spots, they’re currently occupied by “it’s a small world” (18 min), Peter Pan’s Flight (17 min), Haunted Mansion (17 min) Astro Orbiter (16 min), and Space Mountain (14 min).

data source: Thrill-Data.com
Conclusions
It’s widely known now that attendance at Walt Disney World has been low, even lower than Disney expected. While each park still has its standout rides, the waits have consistently been low enough that even simple strategy allows you to have a good visit to the parks these days (provided you’re comfortable visiting at all).