
We’ve officially made it two weeks! Welcome to the July 24 edition of the weekly Magic Kingdom Wait Time Scorecard. At Magic Kingdom, I focus on nine rides that tend to have the highest wait times in the park. This post covers Saturday, July 18 through Friday, July 24.
About + Related Posts
If you’re new to the wait time scorecards, check out our post explaining our Disney World Wait Time Scorecards. That post explains the different numbers you’ll see here including why they’re imperfect. Our wait time scorecards are based on the last week of data from Thrill-Data.com.
Here are the most recent looks at wait times across the four parks:
Magic Kingdom Wait Times (Week End July 24) (you are here)
For upcoming trips, you’ll also want to consult our masterpost on the reopening of Disney World.
This post works in tandem with our Magic Kingdom Rope Drop Strategy post, which addresses things like how to get to the park and what time to arrive. If you’re new to Disney World planning, you might also want to read our Guide to Rides and Entertainment at Magic Kingdom, which includes descriptions of the rides.
This Week’s Bottom Line
Wait times nudged up from last week, but not that much, and the differences were probably mostly due to last Wednesday and Thursday being slow because of the reopening of Hollywood Studios and Epcot.
Our recommended morning ride order is now Seven Dwarfs Mine Train, Peter Pan’s Flight, Big Thunder Mountain Railroad, Splash Mountain, Jungle Cruise.
The Magic Kingdom Wait Time Scorecard
The scorecard is presented in five parts, with the first three being the most important.
Average Waits and Daily Trends
Wait times nudged up from last week, but not that much. Only three rides (of those we track) saw average waits increase by more than five minutes—Seven Dwarfs Mine Train (+6), Big Thunder Mountain Railroad (+8), and Jungle Cruise (+5).

Data Source: Thrill-Data.com
But, as we’ll see in a below table, all three of those still spent the majority of the week with waits at or under 30 minutes (74% for Seven Dwarfs, 69% for Big Thunder Mountain Railroad, 69% for Jungle Cruise).
That’s a drop from last week—91%, 88%, 91%—but not a drop likely to impact your day, particularly if you’re visiting these rides at the beginning of the day.
When look at daily trends, we did see a shift in wait times for Splash Mountain this week. The shift in patterns is enough for us to change our morning recommendations. Last week we recommended the following:
Seven Dwarfs Mine Train
Big Thunder Mountain Railroad
Splash Mountain
Jungle Cruise
This was because Splash Mountain was see waits move up earlier than in the past, possibly due to the announcement during the closure that the ride would get rethemed to Princess and the Frog sometime soon.
Whatever the case, Splash Mountain waits have pulled back a bit, and now five-minute waits are the norm for the first 30 to 60 minutes of the day. As a result, you now have time for three rides before Splash, and we have a new recommendation:
Seven Dwarfs Mine Train
Peter Pan’s Flight
Big Thunder Mountain Railroad
Splash Mountain
Jungle Cruise
The change is the addition of a stop at Peter Pan’s Flight as you walk from Seven Dwarfs Mine Train to Big Thunder Mountain Railroad.
This might push Jungle Cruise a little too late. If the Jungle Cruise wait is at or over 30 minutes, consider visiting Haunted Mansion or Pirates of the Caribbean instead. Jungle Cruise spends 69% of the week with waits at or under 30 minutes, and its median afternoon waits are around 30 minutes.
The Wednesday / Thursday Skew
One thing you see when you compare the week over week numbers is how much Wednesday and Thursday are skewing things. If you look at an average of average waits, Sunday through Tuesday are roughly +/- 2 minutes, while Wednesday and Thursday saw +7 and +6 minute increases week over week.
This is important because last week Wednesday and Thursday saw low crowds because most guests were at Epcot and Hollywood Studios, which reopened last Wednesday.
So the Wednesday/Thursday increases at Magic Kingdom this week aren’t so much due to a surge of crowds this week as they are due to crowds being lower last week because people were at the newly reopened Hollywood Studios and Epcot.
As a result, the overall bump in wait times is skewed by those two low-crowd days from last week.
Wait Time Distribution
This is still my favorite table:

Data Source: Thrill-Data.com
Waits over 45 minutes were very rare. Waits at or under 30 minutes were the norm for all rides, and waits at or under 15 minutes were the norm for Pirates of the Caribbean, Haunted Mansion, Astro Orbiter, and Space Mountain.
Median Afternoon Waits
This is a new metric, replacing minimum afternoon wait. I decided minimum was too easily skewed by a ride spending just a few minutes at a very low wait time, and median is the better way to judge what you should and shouldn’t push into the afternoon.

Data Source: Thrill-Data.com
You can see that Splash Mountain, Seven Dwarfs Mine Train, Big Thunder Mountain Railroad, and Jungle Cruise are the rides to avoid pushing into the afternoon, with afternoon medians often at or over 30 minutes. On weekends, Pirates of the Caribbean isn’t great in the afternoon, either.
Maximum Waits
Maximums at Magic Kingdom aren’t incredibly high. Splash Mountain spent a small bit of Friday afternoon at 80 minutes, but that was partly because the ride spent 31% of the day down. The hourish maximum waits here are in contrast to the situation over at Hollywood Studios, where we regularly saw 100-minute waits for Mickey & Minnie’s Runaway Railway.
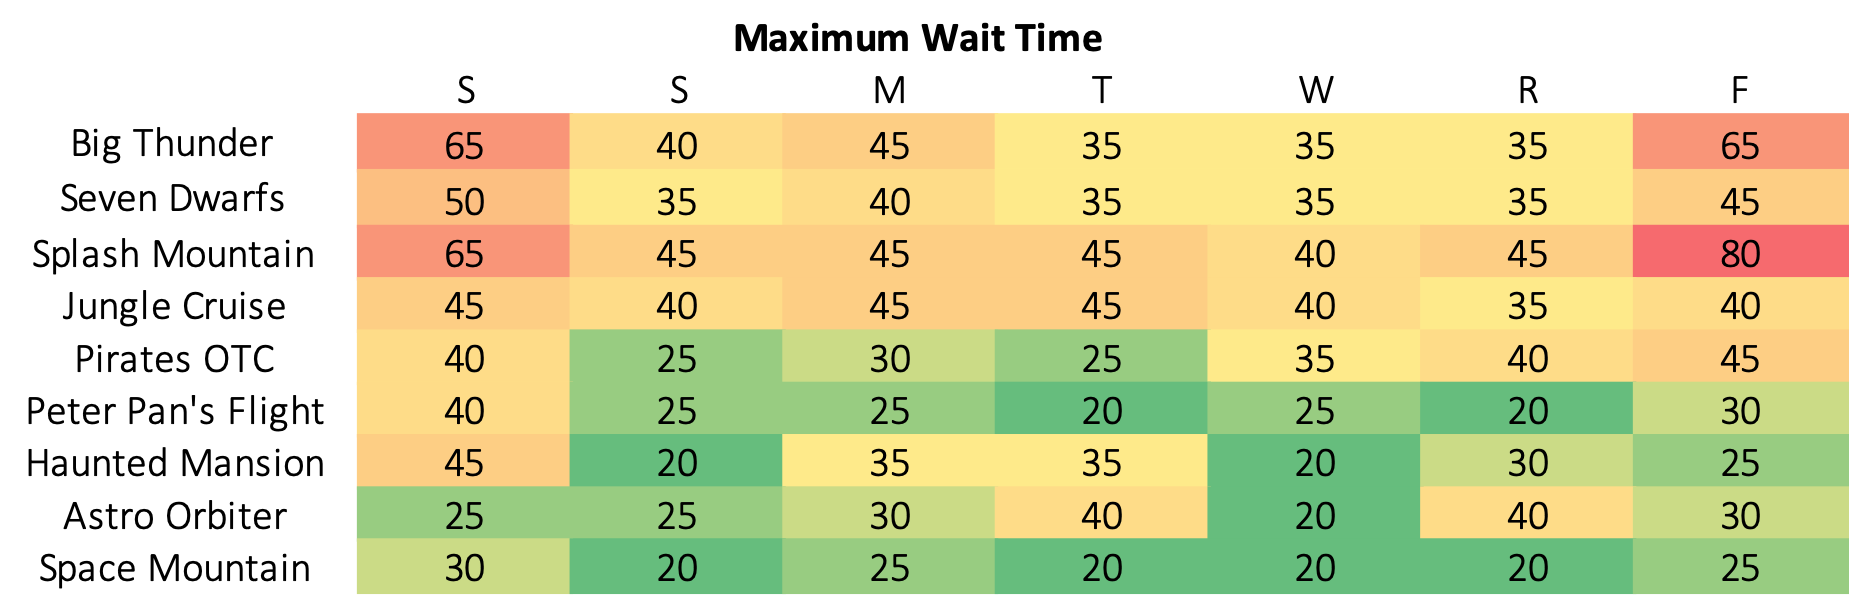
Data Source: Thrill-Data.com
Downtime
I added downtime to this week’s scorecard. I discuss the good/bad about this data point in the Disney World Wait Time Scorecard post. The short of it is that it’s a bad metric because some downtime is weather related and you can plan around that. But it’s a good data point because if a ride is down a lot, you might want to prioritize it when you see it running.

Data Source: Thrill-Data.com
Nothing particularly jumps out about this table. The Saturday downtime was weather-related (thought admittedly I’m unsure why Pirates was impacted).
Conclusions
Magic Kingdom waits are creeping up. Even with low crowds, the park is still a strong, full-day park. You’ll probably ride a few major rides in the morning and a few in the afternoon. Around those, you have plenty of “minor” rides that consistently have short waits along with some great shows—Country Bear Jamboree and Enchanted Tiki Room, for example.